Shvayba D. N. Heuristic methods of forecasting social and economic security
Shvayba D. N. Heuristic methods of forecasting social and economic security
Образец ссылки на эту статью: Shvayba D. N. Heuristic methods of forecasting social and economic security // Бизнес и дизайн ревю. 2019. № 2 (14). С. 5.
УДК 338.2 (476)+316.42 (476)
Shvayba Dmitriy Nikolaevich
HEURISTIC METHODS OF FORECASTING SOCIAL AND ECONOMIC SECURITY
The Minsk regional organization of the Belarusian trade Union of workers of chemical, mining and petroleum industries, Minsk, Belarus (220140, St. Ciurlionis 8-37), candidate of economic Sciences, member of the State expert Council of the State Committee for science and technologies of Republic of Belarus, doctoral student of Belarusian national technical University, ORCID: 0000-0001-6783-9765, shvabia@tut.by, +375 29 652 06 03.
Abstract. The introduction of heuristic methods allows to take into account the presence of trends in the pre-forecast period and the emergence of fundamentally new phenomena in the predictable process of ensuring socio-economic security in the period of pre-emption. In this case, the issue of the reliability of monitoring comes to the front of the study. In determining the reliability of monitoring, the most used methods of verification were found: consequent, indirect, direct, error accounting, and inversion. The consequent verification is carried out by analytical and regular detection of monitoring from the previously carried out monitoring. The verification of the forecast of a certain statistical indicator of socio-economic security way consenquences verification it is possible to use, for example, monitoring other financial and economic parameters, calculated with the support of the photographic method of predicting. The visible defect of the verification method is considered to be the extension of the range of forecast values of certain statistical characteristics of socio-economic security by taking into account other canonical statistical characteristics in the area of permitted values.
Key words: socio-economic security; the government; society; enterprise; employee; threat; security; interests; Economics, analysis, system.
Швайба Дмитрий Николаевич
ЭВРИСТИЧЕСКИЕ СПОСОБЫ ПРОГНОЗИРОВАНИЯ СОЦИАЛЬНО-ЭКОНОМИЧЕСКОЙ БЕЗОПАСНОСТИ
Минская областная организация Белорусского профсоюза работников химической, горной и нефтяной отраслей промышленности, Минск, Беларусь (220140, г. Минск, ул. Чюрлениса 8-37), кандидат экономических наук, член Государственного экспертного совета Государственного комитета по науке и технологиям Республики Беларусь, докторант Белорусского национального технического университета, ORCID: 0000-0001-6783-9765, shvabia@tut.by, +375 29 652 06 03.
Аннотация. Внедрение эвристических способов разрешает принимать во внимание наличие в допрогнозном периоде тенденции и возникновение принципиально свежих явлений в предсказуемом процессе обеспечивания социально-экономической безопасности в периоде упреждения. В этом случае на фронтальный план изучения выходит вопрос достоверности мониторингов. При определении достоверности мониторингов наибольшее использование обнаружили способы верификации: консенквентная, косвенная, прямая, учётом ошибок, и инверсия. Консенквентная верификация ведется путём аналитического и закономерного выявления мониторинга из ранее осуществленных мониторингов. При верификации прогнозного определенного статистического показателя социально-экономической безопасности способом консенквентной верификации возможно применить, к примеру, мониторинги иных финансово-экономических характеристик, исчисленных с поддержкой фотографических способов прогнозирования. Видимым дефектом способа верификации считается наращивание области прогнозных значений определенных статистических характеристик социально-экономической безопсности за счёт учёта в области разрешенных значений иных канонических статистических характеристик.
Ключевые слова: социально-экономическая защищенность; государство; общество; предприятие; работник; угроза; защищенность; интересы; экономика, анализ, система.
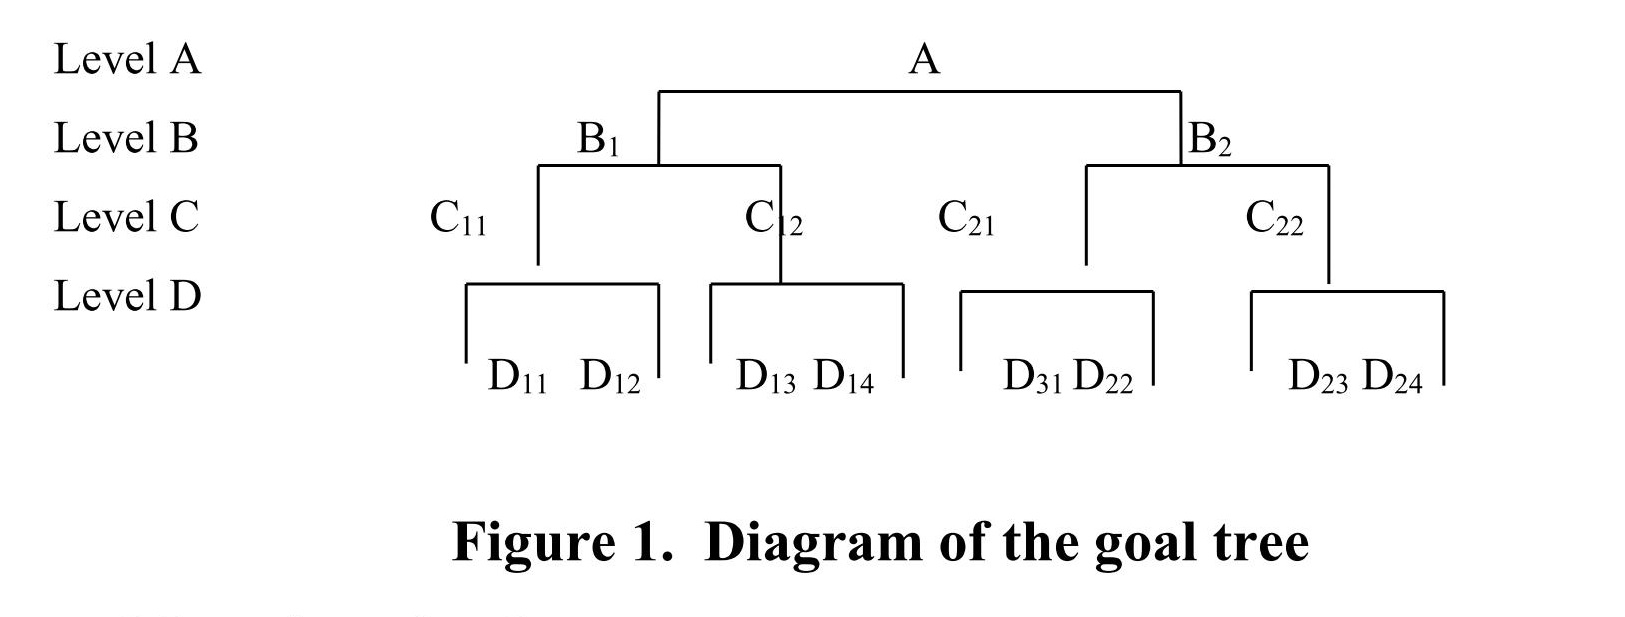
In graph theory, we consider questions in the highest flow, the optimal flow, cycles (loops), etc. if a connected graph is aimed and has no loop, then such a graph is called a graph-tree or a tree of goals, that is, a tree is a connected graph that expresses the subordination and connection of components [1].
The goal tree is developed on the basis of the gradual allocation of less important activities and values. In the simplest goal tree, any view at a lower level is divided into a number of even lower values. The branches emanating from the same vertex are required to be mutually exclusive and present a number of closed arrays with enumeration of all elements of the array.
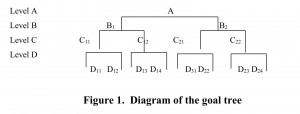
Source: elaboration of author
A similar target tree (with a significant and the smallest number of levels) is formed to solve each of the individual problems. When the goals are met at a lower level, they are achieved at a later higher level (and so on until the joint goal is achieved). To determine the significance and significance of approaches to any of them, if possible, the coefficients of conditional significance are assigned. The value of the coefficients is assigned by specialists who identify the importance and preference of any of the sub-goals (approaches). When assigning coefficients, specialists provide that their sum at the same level must be equal to one. When applying forecast graph any arc leaving a vertex is assigned a coefficient conditional significance Zij, which characterizes the contribution of individual components in the sub-goals of the forecast graph. Moving from the top to the bottom of the tree on different branches (chains), it is possible to determine the coefficient of conditional significance for any branch of the tree goals.
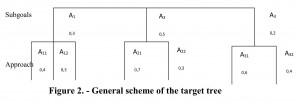
Source: elaboration of author
In General, taking into account the long-term, medium-term and short-term objectives of the tree scheme is shown in figure 2.
The probability of implementing a goal tree to predict the characteristics of socio-economic security with the support of heuristic methods is described in a number of studies [1, 2, 3, 4]. To achieve the goals set in separate blocks, various methods are used, for example in Delphi.
The essence of the method "Delphi" is to obtain an average estimate of the value of the characteristics in the forecast period. The main steps of the "Delphi" method are: recruitment of a group of professionals, formulation of the purpose of examination and questionnaire questions, the procedure of working with specialists, testing and processing of completed questionnaires, monitoring verification.
So it is possible to form a conclusion that the introduction of heuristic methods allows to take into account the presence of trends in the pre-forecast period and the emergence of fundamentally new phenomena in the predictable process of ensuring socio-economic security in the lead period. In this case, the question of the reliability of monitoring comes to the frontline of the study.
When determining the reliability of monitoring, the most used methods of verification were found: consequent, indirect, direct, error-taking, and inversion [1, 2, 3, 4].
The consequent verification is carried out by analytical and natural detection of monitoring from the previously carried out monitoring. When verifying a certain forecast statistical indicator of socio-economic security by means of consequent verification, it is possible to apply, for example, monitoring of other financial and economic characteristics calculated with the support of photographic forecasting methods.
A visible defect of the verification method is considered to be the increase in the range of forecast values of certain statistical characteristics of socio-economic security by taking into account in the area of permitted values of other canonical statistical characteristics.
At constant identification and consideration of sources of error is implemented in the verification of the monitoring subject error. These errors include the systematic (justification of the method of prediction, procedure, work method, lack of ability of the forecaster, the incompleteness of the initial data) and irregular (the appearance of random fluctuations, or basically a fresh phenomenon in the development of the simulated process).
See appropriate systematic errors to eliminate entirely any monitoring irregular are required to provide used methods of forecasting.
Verification of monitoring by comparison with monitoring acquired from other information sources is referred to as indirect. The use of this method of verification is limited, since the development of the provided simulated process in the literature, reports, etc.may not be.
With direct verification compares the forecast results of the acquired different ways of forecasting. The complexity of the application of the presented method of verification is justified by the probability of obtaining 2, 3 or more groups of sets of varieties of monitoring, formed with the support of various factual methods. Preference for the 1st option (or group of options) has the opportunity to be given only on the basis of any empirical data or natural prerequisites.
More often in the practice of calculations when forecasting the statistical characteristics of socio-economic security, the inverse verification is used, which is carried out by testing the adequacy of the prognostic model in the retrospective period. In determining the adequacy of the model to the simulated process, a number of statistical criteria are used – the absolute characteristics of the monitoring error, the comparative characteristics of the monitoring accuracy, etc.
Thus, the absolute characteristics that allow to quantitatively qualify the value of point monitoring in units of predictable object or in % are:
In literary sources [5] it is stated that there is a connection between and Gt most often in practice, the ratio is performed

The defect of the above characteristics is that the meaning of these characteristics depends on the scale of measurement of their values. As a result, the absolute monitoring error is expressed as a percentage
KH = 0 when applying a forecast model that adequately describes the simulated process, and KH =1 if the forecast has the same error as the forecast standards.
The KН mismatch factor does not contain an upper end face. In this connection, the scientific literature considers various transformations of the coefficient of discrepancy. Thus, the coefficient of discrepancy KН=1, defined as private from the division of the standard error of monitoring on the same error, which would have had the opportunity to be, if taken as a monitoring for any year, the average variable for the whole stage

High-quality indicators of monitoring accuracy include such characteristics that make it possible to perform testing of monitoring errors, decompose them into elements. Thus, the essence of the "forecast-implementation" method is to build an array of clear monitoring in coordinates – on one axis the real variable indicator is postponed, on the other – the predicted one [6]. With the support of the chart, the quality of all kinds of monitoring is assessed, more classical errors (underestimations or reassessments) differ, etc.
So the oversight monitoring to decompose into blocks of inconsistencies since properties monitoring based on a standard error monitoring. The square of the mean square error Of G. Teil expressed as follows [7]:
where: and – average of expected and actual values for variables;
R-correlation coefficient between the proposed and actual values;
– variance of expected and actual values of variables.
The decomposition of the mean square error into components makes it possible to determine the parts of the discrepancy, namely:
Thus, the probability of selecting a model that correctly characterizes the process of ensuring socio-economic security in the retrospective period is revealed, however, in the period of pre-emption, there are all chances (and will) manifest a fundamentally fresh phenomenon in the development of a predictable process[9; 10]. As a result, it is recommended to use an array of factual and heuristic methods for verification of monitoring, allowing to extrapolate the trends of the development of the phenomenon and its qualitative change in the period of pre-emption.
Список литературы
References
Рецензенты:
Мальцева Е. С. – кандидат экономических наук, доцент, АНО ВО «Институт бизнеса и дизайна»
Проданова Н. А. – доктор экономических наук, профессор кафедры финансового анализа и аудита ФГБОУ ВО «РЭУ им. Г. В. Плеханова»
Работа поступила в редакцию: 25.12.2018 г.
УДК 338.2 (476)+316.42 (476)
Shvayba Dmitriy Nikolaevich
HEURISTIC METHODS OF FORECASTING SOCIAL AND ECONOMIC SECURITY
The Minsk regional organization of the Belarusian trade Union of workers of chemical, mining and petroleum industries, Minsk, Belarus (220140, St. Ciurlionis 8-37), candidate of economic Sciences, member of the State expert Council of the State Committee for science and technologies of Republic of Belarus, doctoral student of Belarusian national technical University, ORCID: 0000-0001-6783-9765, shvabia@tut.by, +375 29 652 06 03.
Abstract. The introduction of heuristic methods allows to take into account the presence of trends in the pre-forecast period and the emergence of fundamentally new phenomena in the predictable process of ensuring socio-economic security in the period of pre-emption. In this case, the issue of the reliability of monitoring comes to the front of the study. In determining the reliability of monitoring, the most used methods of verification were found: consequent, indirect, direct, error accounting, and inversion. The consequent verification is carried out by analytical and regular detection of monitoring from the previously carried out monitoring. The verification of the forecast of a certain statistical indicator of socio-economic security way consenquences verification it is possible to use, for example, monitoring other financial and economic parameters, calculated with the support of the photographic method of predicting. The visible defect of the verification method is considered to be the extension of the range of forecast values of certain statistical characteristics of socio-economic security by taking into account other canonical statistical characteristics in the area of permitted values.
Key words: socio-economic security; the government; society; enterprise; employee; threat; security; interests; Economics, analysis, system.
Швайба Дмитрий Николаевич
ЭВРИСТИЧЕСКИЕ СПОСОБЫ ПРОГНОЗИРОВАНИЯ СОЦИАЛЬНО-ЭКОНОМИЧЕСКОЙ БЕЗОПАСНОСТИ
Минская областная организация Белорусского профсоюза работников химической, горной и нефтяной отраслей промышленности, Минск, Беларусь (220140, г. Минск, ул. Чюрлениса 8-37), кандидат экономических наук, член Государственного экспертного совета Государственного комитета по науке и технологиям Республики Беларусь, докторант Белорусского национального технического университета, ORCID: 0000-0001-6783-9765, shvabia@tut.by, +375 29 652 06 03.
Аннотация. Внедрение эвристических способов разрешает принимать во внимание наличие в допрогнозном периоде тенденции и возникновение принципиально свежих явлений в предсказуемом процессе обеспечивания социально-экономической безопасности в периоде упреждения. В этом случае на фронтальный план изучения выходит вопрос достоверности мониторингов. При определении достоверности мониторингов наибольшее использование обнаружили способы верификации: консенквентная, косвенная, прямая, учётом ошибок, и инверсия. Консенквентная верификация ведется путём аналитического и закономерного выявления мониторинга из ранее осуществленных мониторингов. При верификации прогнозного определенного статистического показателя социально-экономической безопасности способом консенквентной верификации возможно применить, к примеру, мониторинги иных финансово-экономических характеристик, исчисленных с поддержкой фотографических способов прогнозирования. Видимым дефектом способа верификации считается наращивание области прогнозных значений определенных статистических характеристик социально-экономической безопсности за счёт учёта в области разрешенных значений иных канонических статистических характеристик.
Ключевые слова: социально-экономическая защищенность; государство; общество; предприятие; работник; угроза; защищенность; интересы; экономика, анализ, система.
In graph theory, we consider questions in the highest flow, the optimal flow, cycles (loops), etc. if a connected graph is aimed and has no loop, then such a graph is called a graph-tree or a tree of goals, that is, a tree is a connected graph that expresses the subordination and connection of components [1].
The goal tree is developed on the basis of the gradual allocation of less important activities and values. In the simplest goal tree, any view at a lower level is divided into a number of even lower values. The branches emanating from the same vertex are required to be mutually exclusive and present a number of closed arrays with enumeration of all elements of the array.
Source: elaboration of author
A similar target tree (with a significant and the smallest number of levels) is formed to solve each of the individual problems. When the goals are met at a lower level, they are achieved at a later higher level (and so on until the joint goal is achieved). To determine the significance and significance of approaches to any of them, if possible, the coefficients of conditional significance are assigned. The value of the coefficients is assigned by specialists who identify the importance and preference of any of the sub-goals (approaches). When assigning coefficients, specialists provide that their sum at the same level must be equal to one. When applying forecast graph any arc leaving a vertex is assigned a coefficient conditional significance Zij, which characterizes the contribution of individual components in the sub-goals of the forecast graph. Moving from the top to the bottom of the tree on different branches (chains), it is possible to determine the coefficient of conditional significance for any branch of the tree goals.

Source: elaboration of author
In General, taking into account the long-term, medium-term and short-term objectives of the tree scheme is shown in figure 2.
The probability of implementing a goal tree to predict the characteristics of socio-economic security with the support of heuristic methods is described in a number of studies [1, 2, 3, 4]. To achieve the goals set in separate blocks, various methods are used, for example in Delphi.
The essence of the method "Delphi" is to obtain an average estimate of the value of the characteristics in the forecast period. The main steps of the "Delphi" method are: recruitment of a group of professionals, formulation of the purpose of examination and questionnaire questions, the procedure of working with specialists, testing and processing of completed questionnaires, monitoring verification.
So it is possible to form a conclusion that the introduction of heuristic methods allows to take into account the presence of trends in the pre-forecast period and the emergence of fundamentally new phenomena in the predictable process of ensuring socio-economic security in the lead period. In this case, the question of the reliability of monitoring comes to the frontline of the study.
When determining the reliability of monitoring, the most used methods of verification were found: consequent, indirect, direct, error-taking, and inversion [1, 2, 3, 4].
The consequent verification is carried out by analytical and natural detection of monitoring from the previously carried out monitoring. When verifying a certain forecast statistical indicator of socio-economic security by means of consequent verification, it is possible to apply, for example, monitoring of other financial and economic characteristics calculated with the support of photographic forecasting methods.
A visible defect of the verification method is considered to be the increase in the range of forecast values of certain statistical characteristics of socio-economic security by taking into account in the area of permitted values of other canonical statistical characteristics.
At constant identification and consideration of sources of error is implemented in the verification of the monitoring subject error. These errors include the systematic (justification of the method of prediction, procedure, work method, lack of ability of the forecaster, the incompleteness of the initial data) and irregular (the appearance of random fluctuations, or basically a fresh phenomenon in the development of the simulated process).
See appropriate systematic errors to eliminate entirely any monitoring irregular are required to provide used methods of forecasting.
Verification of monitoring by comparison with monitoring acquired from other information sources is referred to as indirect. The use of this method of verification is limited, since the development of the provided simulated process in the literature, reports, etc.may not be.
With direct verification compares the forecast results of the acquired different ways of forecasting. The complexity of the application of the presented method of verification is justified by the probability of obtaining 2, 3 or more groups of sets of varieties of monitoring, formed with the support of various factual methods. Preference for the 1st option (or group of options) has the opportunity to be given only on the basis of any empirical data or natural prerequisites.
More often in the practice of calculations when forecasting the statistical characteristics of socio-economic security, the inverse verification is used, which is carried out by testing the adequacy of the prognostic model in the retrospective period. In determining the adequacy of the model to the simulated process, a number of statistical criteria are used – the absolute characteristics of the monitoring error, the comparative characteristics of the monitoring accuracy, etc.
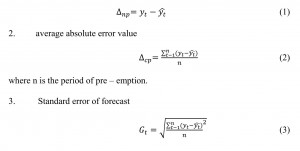
Thus, the absolute characteristics that allow to quantitatively qualify the value of point monitoring in units of predictable object or in % are:
- absolute forecast error, excluded as the difference between the actual value yt and forecast

In literary sources [5] it is stated that there is a connection between and Gt most often in practice, the ratio is performed
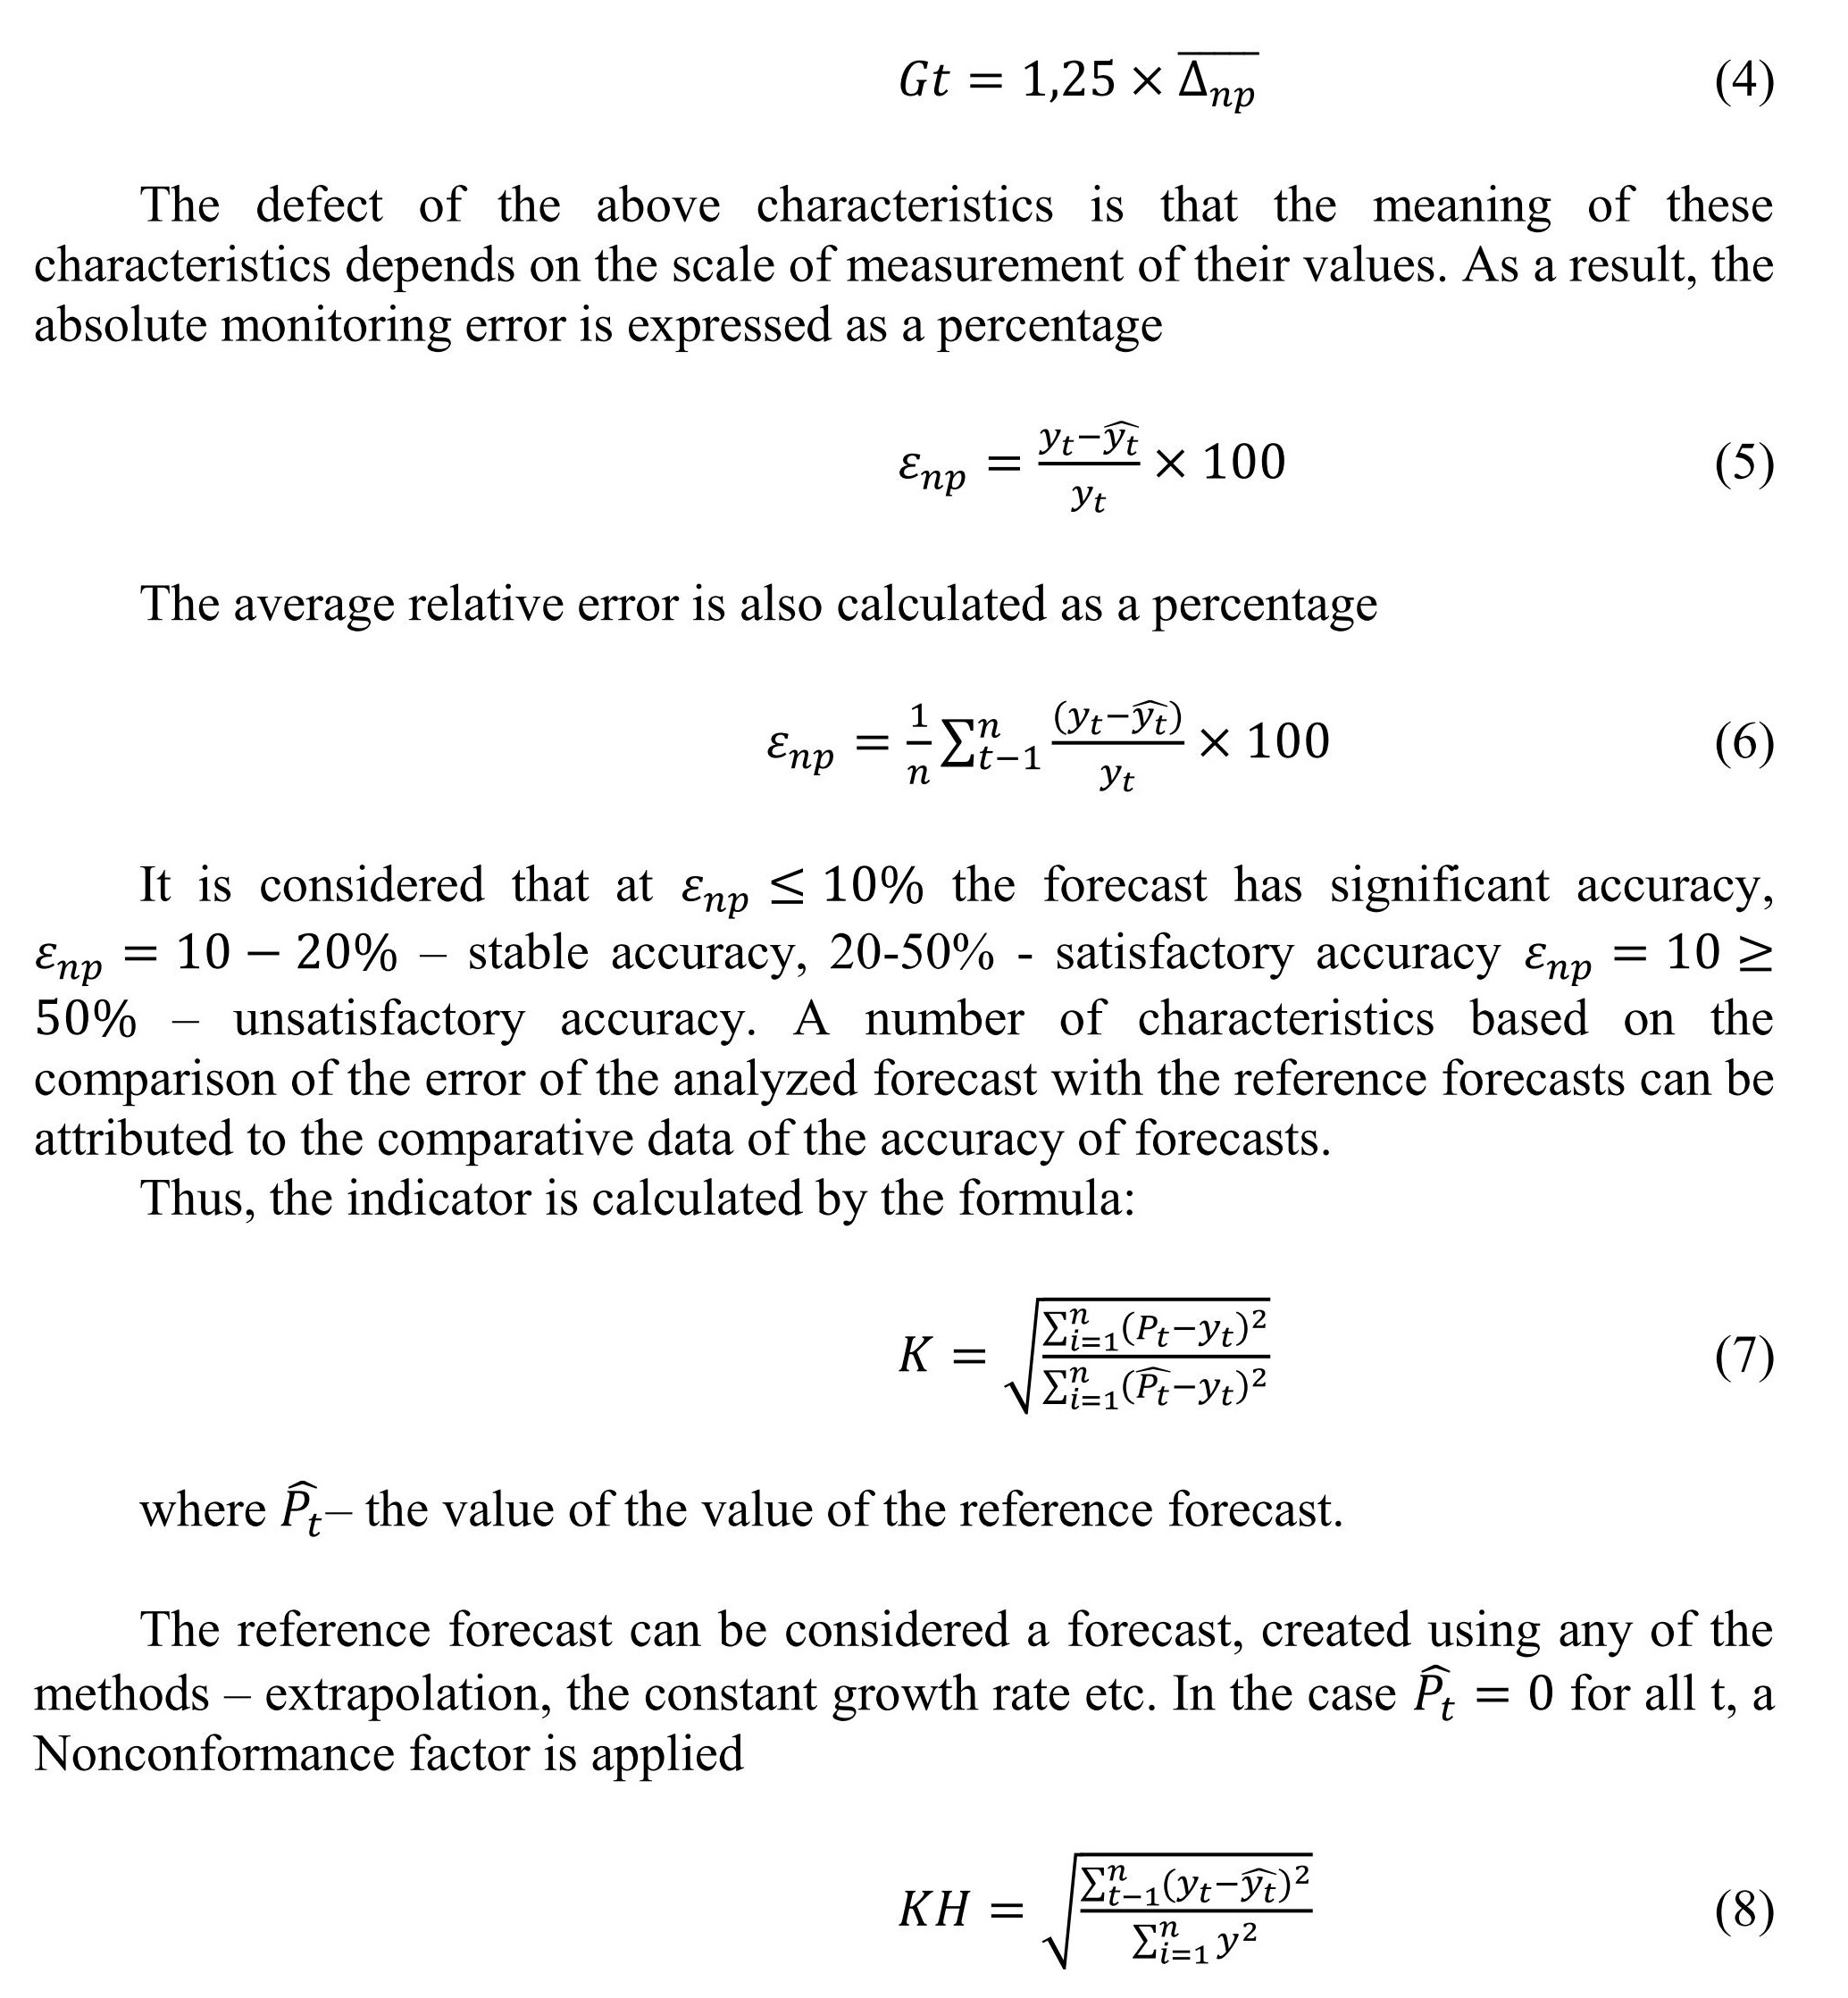
The defect of the above characteristics is that the meaning of these characteristics depends on the scale of measurement of their values. As a result, the absolute monitoring error is expressed as a percentage
KH = 0 when applying a forecast model that adequately describes the simulated process, and KH =1 if the forecast has the same error as the forecast standards.
The KН mismatch factor does not contain an upper end face. In this connection, the scientific literature considers various transformations of the coefficient of discrepancy. Thus, the coefficient of discrepancy KН=1, defined as private from the division of the standard error of monitoring on the same error, which would have had the opportunity to be, if taken as a monitoring for any year, the average variable for the whole stage
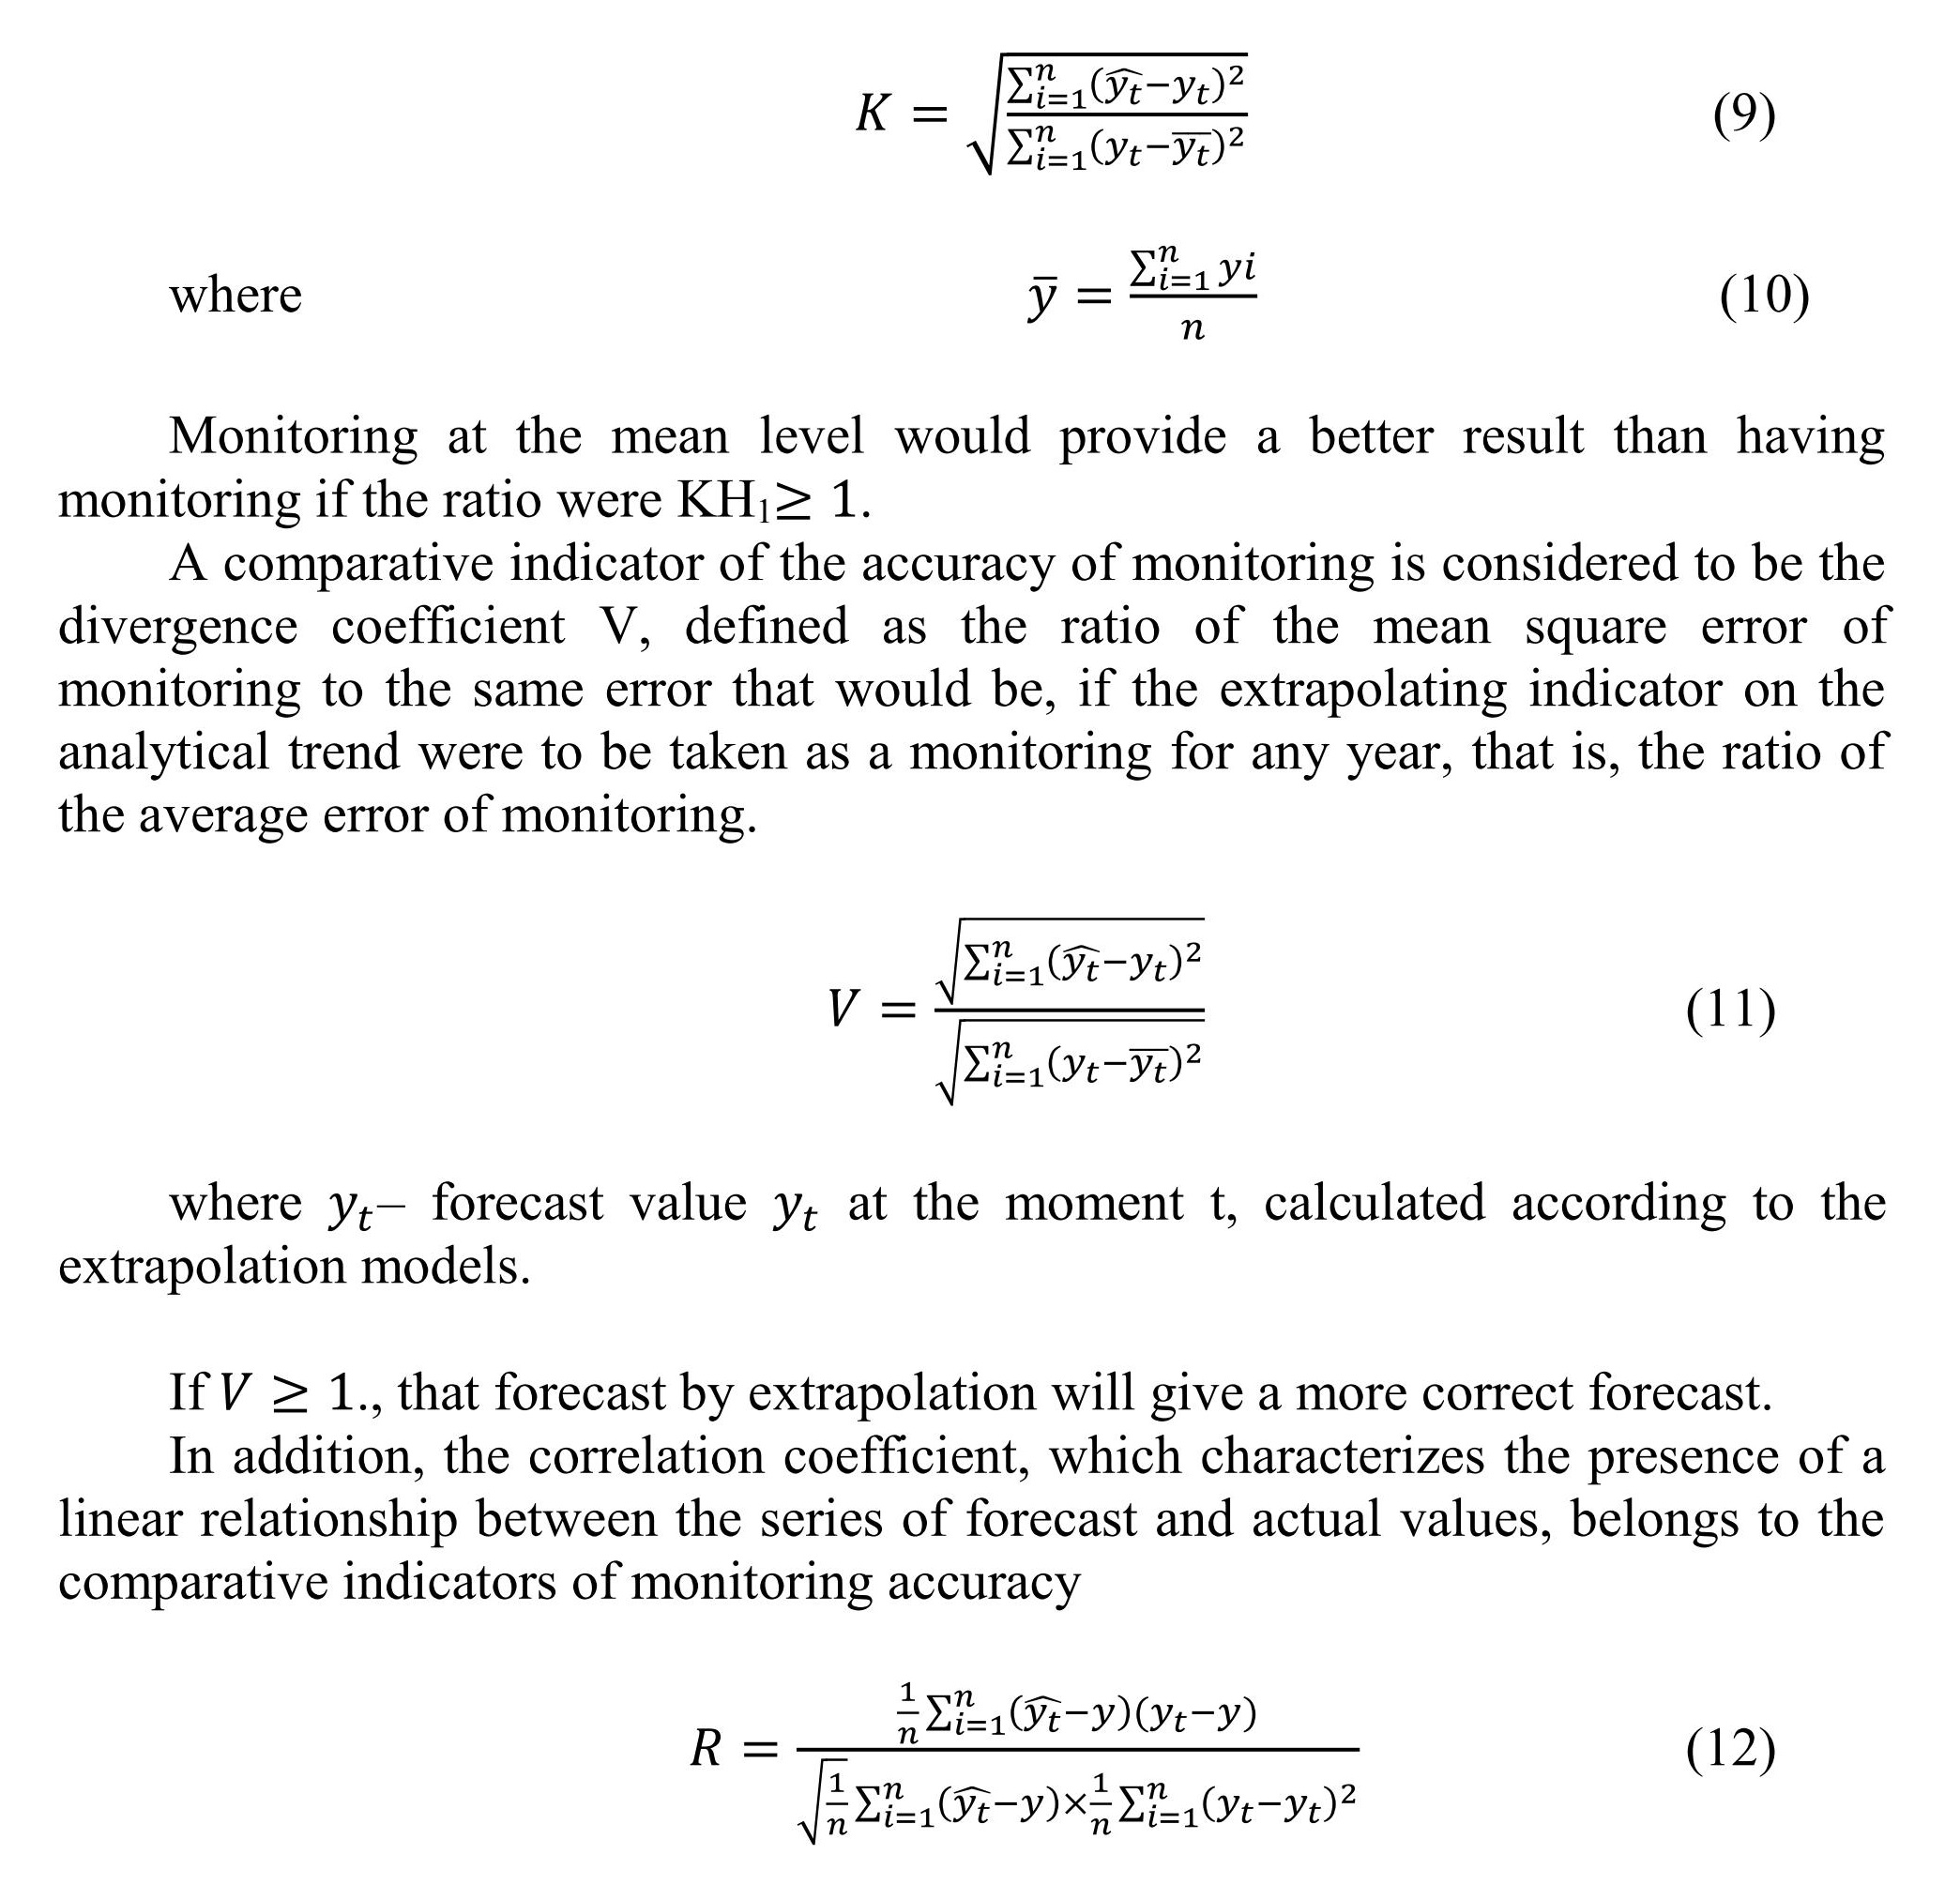
High-quality indicators of monitoring accuracy include such characteristics that make it possible to perform testing of monitoring errors, decompose them into elements. Thus, the essence of the "forecast-implementation" method is to build an array of clear monitoring in coordinates – on one axis the real variable indicator is postponed, on the other – the predicted one [6]. With the support of the chart, the quality of all kinds of monitoring is assessed, more classical errors (underestimations or reassessments) differ, etc.
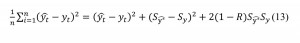
So the oversight monitoring to decompose into blocks of inconsistencies since properties monitoring based on a standard error monitoring. The square of the mean square error Of G. Teil expressed as follows [7]:
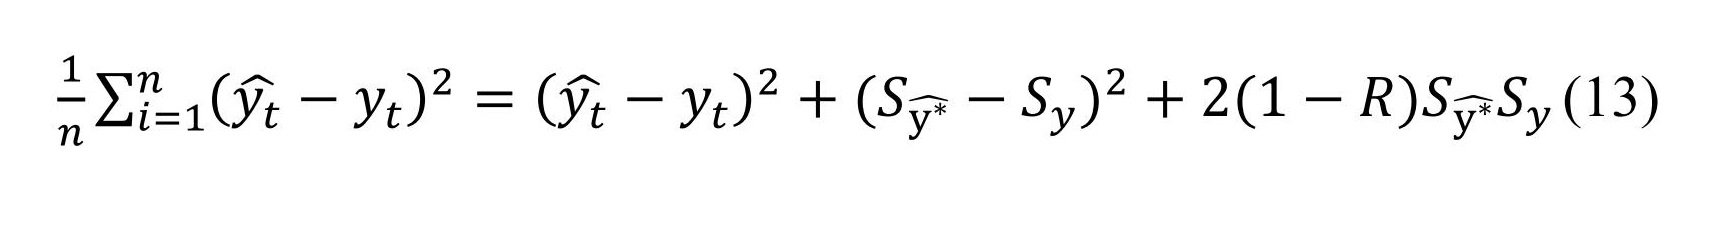
where: and – average of expected and actual values for variables;
R-correlation coefficient between the proposed and actual values;
– variance of expected and actual values of variables.
The decomposition of the mean square error into components makes it possible to determine the parts of the discrepancy, namely:
- – part of the bias describing the presence of an error in the Central trend estimation;
- - part of the variance that shows the degree of convergence between the standard deviations of the assumed and actual values;
- – part of the covariance, the analysis of which is an opportunity to highlight cases where the monitoring, being in satisfactory and , has mutual compensation of the errors for different observations.
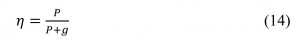
- M. Chetyrkin for the measure of accuracy of interval monitoring introduced the indicator [8], characterized by the ratio of the number of monitoring confirmed by the actual data P to the number of monitoring unconfirmed by the actual data g

Thus, the probability of selecting a model that correctly characterizes the process of ensuring socio-economic security in the retrospective period is revealed, however, in the period of pre-emption, there are all chances (and will) manifest a fundamentally fresh phenomenon in the development of a predictable process[9; 10]. As a result, it is recommended to use an array of factual and heuristic methods for verification of monitoring, allowing to extrapolate the trends of the development of the phenomenon and its qualitative change in the period of pre-emption.
Список литературы
- Блох А. Ш. Граф-схемы и алгоритмы / А. Ш. Блох. Минск: Высшая школа, 1987. 144 с.
- Кузьбожев Э. Н., Трухов В. А. Концепция формирования плана-прогноза социально-экономического развития региона. Сыктывкар-Гомель: СГУ, ГГУ, 1992. С. 34 – 37.
- Королев Ю. Г. Методы «дерева цепей» и прогнозного графа / Ю. Г. Королев // Статистическое моделирование и прогнозирование: учеб. пособие / Г. М. Гамбаров [и др.]; под ред. А. Г. Гранберга. М.: Финансы и статистика, 1990. С. 255–257.
- Герасенко В. П. Прогностические методы управления рыночной экономикой: учеб. пособие: в 2 ч. / В. П. Герасенко; под ред. и предисл. Г. К. Котова. Ч. 1. Гомель: БелАльтаир, 1997. 319 с.
- Статистическое моделирование и прогнозирование: учеб. пособие / Г. М. Гамбаров [и др.]; под ред. А. Г. Гранберга. М.: Финансы и статистика, 1990. 382 с.
- Ямпольский С. М. Прогнозирование научно-технического прогресса: методологические аспекты / С. М. Ямпольский, В. М. Лисичкин. М.: Экономика, 1974. 207 с.
- Тейл Г. Прикладное экономическое прогнозирование: пер. с англ. / Г. Тейл; под ред. Э. Б. Ершова. М.: Прогресс, 1970. 510 с.
- Четыркин Е. М. Статистические методы прогнозирования / Е. М. Четыркин. М.: Статистика, 1975. 184 с.
- Shvaiba D. (2018). Structural stability and socio-economic security of the hierarchical system. Bulletin of Science and Practice, 4(6), 233-239. Режим доступа: http://www.bulletennauki.com/shvaiba-d-n-2018 (дата обращения 06.2018). DOI: 10.5281/zenodo.1289852.
- Shvaiba D. (2018). Socio-economic security of the hierarchical system. Bulletin of Science and Practice, 4(6), 248-254. Режим доступа: http://www.bulletennauki.com/shvaiba-d-n (дата обращения 06.2018). DOI: 10.5281/zenodo.1289862.
References
- Blokh A. Sh. Graf-skhemy i algoritmy / A. Sh. Blokh. Minsk: Vysshaya shkola, 1987. 144 p.
- Kuzbozhev E. N., Trukhov V. A. Kontseptsiya formirovaniya plana-prognoza sotsialno-ekonomicheskogo razvitiya regiona. Syktyvkar-Gomel: SGU, GGU, 1992. pp. 34 – 37.
- Korolev Yu. G. Metody «dereva tsepey» i prognoznogo grafa / Yu. G. Korolev - Statisticheskoe modelirovanie i prognozirovanie: ucheb. posobie / G. M. Gambarov [i dr.]; pod red. A. G. Granberga. M.: Finansy i statistika, 1990. pp. 255–257.
- Gerasenko V. P. Prognosticheskie metody upravleniya rynochnoy ekonomikoy: ucheb. posobie: v 2 ch. / V. P. Gerasenko; pod red. i predisl. G. K. Kotova. Ch. 1. Gomel: BelAltair, 1997. 319 p.
- Statisticheskoe modelirovanie i prognozirovanie: ucheb. posobie / G. M. Gambarov [i dr.]; pod red. A. G. Granberga. M.: Finansy i statistika, 1990. 382 p.
- Yampolskiy S. M. Prognozirovanie nauchno-tekhnicheskogo progressa: metodologicheskie aspekty / S. M. Yampolskiy, V. M. Lisichkin. M.: Ekonomika, 1974. 207 p.
- Teyl G. Prikladnoe ekonomicheskoe prognozirovanie: per. s angl. / G. Teyl; pod red. E. B. Ershova. M.: Progress, 1970. 510 s.
- Chetyrkin E. M. Statisticheskie metody prognozirovaniya / E. M. Chetyrkin. M.: Statistika, 1975. 184 p.
- Shvaiba D. (2018). Structural stability and socio-economic security of the hierarchical system. Bulletin of Science and Practice, 4(6), 233-239. Rezhim dostupa: http://www.bulletennauki.com/shvaiba-d-n-2018 (data obrascheniya 15.06.2018). DOI: 10.5281/zenodo.1289852.
- Shvaiba D. (2018). Socio-economic security of the hierarchical system. Bulletin of Science and Practice, 4(6), 248-254. Rezhim dostupa: http://www.bulletennauki.com/shvaiba-d-n (data obrascheniya 15.06.2018). DOI: 10.5281/zenodo.1289862.
Рецензенты:
Мальцева Е. С. – кандидат экономических наук, доцент, АНО ВО «Институт бизнеса и дизайна»
Проданова Н. А. – доктор экономических наук, профессор кафедры финансового анализа и аудита ФГБОУ ВО «РЭУ им. Г. В. Плеханова»
Работа поступила в редакцию: 25.12.2018 г.