
Shvayba D.N. Problematic issues in the analysis of socio-economic security
Shvayba D.N. Problematic issues in the analysis of socio-economic security
Образец ссылки на эту статью: Shvaiba D.N. Problematic issues in the analysis of socio-economic security // Бизнес и дизайн ревю. 2018. № 4 (12). С. 5.
УДК 338.2(476)+316.42(476)
Shvayba Dmitriy Nikolaevich
PROBLEMATIC ISSUES IN THE ANALYSIS OF SOCIO-ECONOMIC SECURITY
The Minsk regional organization of the Belarusian trade Union of workers of chemical, mining and petroleum industries, Minsk, Belarus (220140, St. Ciurlionis 8-37), candidate of economic Sciences, member of the State expert Council of the State Committee for science and technologies of Republic of Belarus, doctoral student of Belarusian national technical University, ORCID: 0000-0001-6783-9765, shvabia@tut.by, +375 29 652 06 03.
Based on the article with the material is the ability of information analysis cube security: graduation of the means of defence in their relationship to threats; gradation of hazards according to their degree of influence; grading objects according to their degree of safety, etc. Described situation allows to systematize the studied elements based on the analysis of multidimensional data. Based on everything, it is possible to structure the dangers, defense methods, objects and other elements of security, taking into account their internal data. The special individuality of the proposed model of systematization is that it allows you to find hidden relationships and patterns between their internal structures, which are not always visible at the stage of description.
Key words: socio-economic security; the government; society; enterprise; employee; threat; security; interests; Economics, analysis, system.
Швайба Дмитрий Николаевич
ПРОБЛЕМНЫЕ ВОПРОСЫ ПРИ АНАЛИЗЕ СОЦИАЛЬНО-ЭКОНОМИЧЕСКОЙ БЕЗОПАСНОСТИ
Минская областная организация Белорусского профсоюза работников химической, горной и нефтяной отраслей промышленности, Минск, Беларусь (220140, г. Минск, ул. Чюрлениса 8-37), кандидат экономических наук, член Государственного экспертного совета Государственного комитета по науке и технологиям Республики Беларусь, докторант Белорусского национального технического университета, ORCID: 0000-0001-6783-9765, shvabia@tut.by, +375 29 652 06 03.
На основе изложенного в статье материала представляется возможность информационного анализа кубика безопасности: градация средств обороны по их соотношению к угрозам; градация опасностей по степени их влияния; градация объектов по степени их безопасности и т.д. Описанный расклад разрешает систематизировать исследуемые элементы, базируясь на анализе многомерных данных. Возможно структурировать опасности, способы обороны, объекты и иные элементы защищенности с учетом их внутренних данных. Особая индивидуальность предложенной модели систематизирования заключается в том, что она разрешает обнаружить сокрытые отношения и закономерности между их внутренними структурами, которые не всякий раз видимы на стадии описания.
Ключевые слова: социально-экономическая защищенность; государство; общество; предприятие; работник; угроза; защищенность; интересы; экономика, анализ, система.
In the analysis of socio-economic security can be used indicator, suitable in that its size is equal to the correlation coefficient of dichotomous symptoms, considered as quantitative:
 (1)
(1)
In this consideration of dichotomous symptoms, it should be noted that the appropriate Boolean columns have (a+b) single values and (c+d) zero values for the 1st symptom and (a+c) single values and (b+d) zero values for the other symptom.
In General, every time it is expected that a symptom of any type has the ability to be represented by several gradations. In connection with this situation, in the theory of data analysis there is a problem of scaling the symptom, that is, measuring it in some selected on a specific aspect, due to the initial information, scale. Without touching upon the choice of measurement scales, I would like to point out that almost every time [1, p. 125] the aspect of the choice of this scale is the maximization of the correlation coefficients of these symptoms r of the matrix R:
 (2)
(2)
Thus, in the process of solving problems aimed at identifying for gradations of non-quantitative symptoms of new relations, allowing to approach their quantitative measurement, 2 information sources are used:
* a priori assumptions of the expert in a certain subject area, acquired in the analysis of the results of processing of experimental data [2].
Let G have an array of security cube scans. Guided by the structural description of the elements gi ( ) the selected array G, we can say that here we are dealing with multidimensional indicators. Let's analyze the element representation gi ( ) using the feature object table. Without limiting the generality, we assume that the chosen element g* - scan cube security in the plane Х0Z - "tools of protection and security challenges". The rows in this table correspond to the security tools, and the columns correspond to the array of possible security calls. The task that arises at this stage can be set in such a way: according to the existing description of the array of security tools, to identify security challenges that this complex can best counteract. For mathematical processing of the problem can be formalized.
Let there be a table object-a sign of dimension N×M, including sub-tables dimensions , where , which correspond to the specified feature (in a particular case - the call) Хк. Overall, the matrix Хк capable of having one of the following types:
3) Хк - an arbitrary Boolean matrix . The columns of this matrix are not necessarily orthogonal to each other, and individual rows can be zero. The first fact means that the indicators of the symptom are not alternative, and the second-that for individual objects the indicators of symptoms are not specified. In fact, this submatrix can often be considered as an array of columns corresponding to certain symptom values, that is, as a set of symptoms specified in the form of 2.
The challenge is to model this quantitative symptom z, which is the closest to matrices Хk, and identify the rules of its interpretation in the descriptions of the primary symptoms.
To estimate the proximity of z to the original matrices, it seems logical to apply an estimate of the distances between the symptoms and their projections to the corresponding subspaces. At the same time, 2 symmetrical indicators are formed in a certain sense.
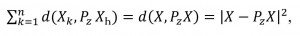
The 1st of them considers the proximity between the simulated symptom and its projections on subspaces L(Хk), which are created by primary symptoms:
 (3)
(3)
where by means Рк the0 projector to the subspace is shown L(Хk).
The second explores the proximity between the primary matrices and their projections on the axis of the modeled indicator:
 (4)
(4)
In this case, the problem of modeling the vector z is stated as the problem of reducing one of these indicators for all N-dimensional vectors z having a unit length, that is
 (5)
(5)
It should be noted that 2 modeling problems are similar in mathematical structure. They should be considered as special cases of a more General modeling problem based on the study of "oblique" scalar products of the form , not , and "oblique" projectors ХВ'Х.
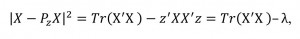
The formed problem is easier to solve by modeling the factor-projector, that is, using the criterion (4), since in this case the solution is less massive and more constructive. First of all, we note that
 (6)
(6)
where performance X = (Х1,...,Хn) the entire table of primary data is formed. The formula (6) follows from the definition of the scalar product.
It is known that the problem of reducing the index z such that , the task of identifying the main components of the matrix X.
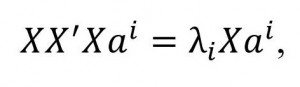
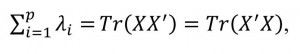
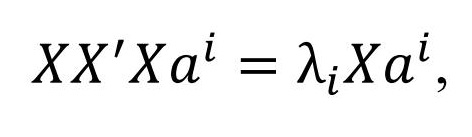
We investigate the matrix of conjugacy of features S=X’X. Its elements are scalar products of Boolean columns corresponding to various values of features. If λ1, λ2, …, λk - the eigenvalues of the matrix S over the field C. Since S is the Gram matrix, the eigenvalues are real and positive when detS≠0. Then a1, a2, …, ak - normalized eigenvectors of the matrix S corresponding to eigenvalues. This means that . Therefore,
 (7)
(7)
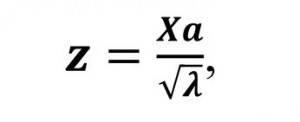
Get that vector there is an eigenvector of the matrix , corresponding to the same eigenvalue , that and the vector , acting proper for the matrix . Since , that . Prohormones identified eigenvectors of a matrix and select them through z1, z2, …, z k:
 (8)
(8)
Vectors you can call the main components of the matrix X.
For the interpretation of the obtained vector z it is necessary to estimate the weight of the occurrence of primary features ХҺ vector z. This assessment is more convenient, in General, to produce their investment in the amount of λ.
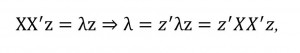
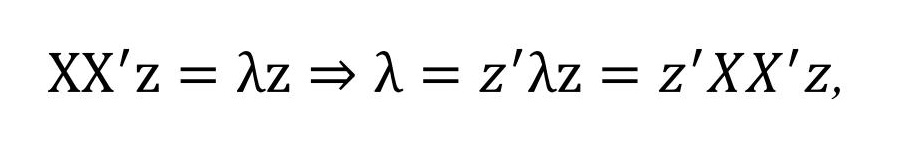
Let z be the eigenvector of the matrix XX', corresponding to the eigenvalue λ. Then
 (9)
(9)
From the properties of the matrix we obtain that
 (10)
(10)
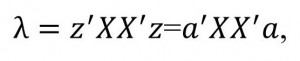
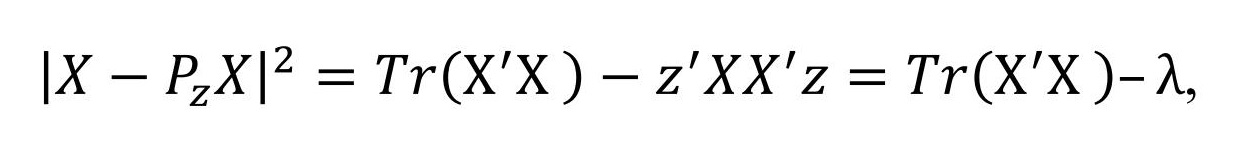
It is evident that the task of the reduction indicator (4) corresponds to the objective of decreasing eigenvalues λ. Since
 (11)
(11)
the analysis of λ adequate analysis of the vector z. λ is the sum of the values okharakterizovali the contribution of each of the combinations of indicators of symptoms in the optimized indicator. As a result of the corresponding transformations, it is possible to obtain
 (12)
(12)
These values characterize the significance of symptoms, individual values and pairs of symptoms in terms of their contribution to the optimized indicator and have all chances to be used for the interpretation of the resulting factor. The larger the significance, the more relevant the symptom (or its exponent, depending on the presentation of the data) takes place in the identified vector z. As a consequence, the vector z can be considered as a formal representation of the generalizing opinion, which is presented in more important symptoms [3].
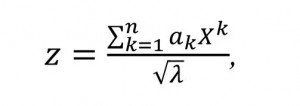
However, in our case representation is simplified. If we expand (9), it is possible to see that the vector z is a linear combination of the values of these symptoms. Data representation in the form of a conditional dichotomous symptom entails the selection of a specific subset of objects possessing the appropriate quality, not only specifies the partitioning of a large number of groups in relation to no one particular quality. As a consequence, presenting the components of a large number of G in the form of tables, we can only denote them as symptoms appear on the internal properties of these components in any particular case. Due to the fact that the task will be reduced to fixing the presence or absence of these manifestations, it is advisable to present symptoms in form 2. As a result, the formula of the main component will look like:
 (13)
(13)
We see that in z the indicators of symptoms are summarized, which are estimated by the values аk, indicating the contribution of relevant indicators of symptoms Хk [4].
When the minimum symptom value (4) is not very small, it can be estimated as an indication that the primary data are not capable of being characterized by a single factor. In this case, in accordance with the General regulations of the method of the parent component as a method of approximation of the data, you should turn to the investigation of matrices of the residual ties , and find their maximum eigenvalue and corresponding normalized eigenvectors а2 and z2. Core components z1 and z2 are orthogonal and create a plane that best approximates the scorecard in the sense of the criterion , where Р - the operator of designing on a given plane. As the first p of the main components z1,z2,...,zр, modeled as eigenvectors corresponding to the maximum eigenvalues of residual matrices , reduce , where Р - modeling operator on L(Zp). The indicator of stopping the process of modeling the head components in accordance with the theory is the proximity to the unit of magnitude , since
 (14)
(14)
With regard to the safety cube, the method allows, on the basis of the systematization carried out, to make compositions of objects/features that correspond to the set of specified data. For example, having identified inherent dangers, it is possible to assess the quality of the security system [5; 6]. Then there is the problem of approximation of the given vector available vectors. This linear regression problem.
Let u-some output indicator, which should be described by the signs z1, z2,..., zk with some valid transformations (in this instance Ф(Z) = L(Z) - array of linear transformations). We need to find the nearest vector to y such that
 (15)
(15)
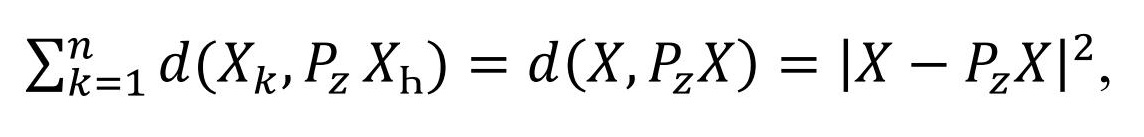
It is known that the solution of the linear regression problem is the projection Рz у. So,
 (16)
(16)
where a is the vector of coefficients of columns of Z.
In the generalized case, the columns of the matrix Z can be linearly dependent, then det(Z’Z)=0. In this case, under the matrix (Z’Z)-1 it is necessary to understand the generalized inverse matrix for Z’Z.
Assessment of the quality of the regression it is advisable to characterize the size
 (17)
(17)
Indicator D is called the coefficient of determination and is modified in the range from 0 to 1. The proximity of D to 1 indicates that the residual dispersion not great, that is, the revealed description is not bad approximates y. In particular, D = 1 if and only if у = у*, so the required description is expressed by the formula (16). If D = 0, that that is у* = 0, so a linear description of u in terms z' no way.
Based on the above, there is the following possibility of information analysis of the security cube:
* gradation of hazards by their degree of influence;
* gradation of objects according to the degree of their safety, etc.
The described layout allows to systematize the studied elements based on the analysis of multidimensional data. Based on this, it is possible to structure the dangers, methods of defense, objects and other elements of security, taking into account their internal data. The special individuality of the proposed systematization model lies in the fact that it allows to detect hidden relationships and patterns between their internal structures, which are not always visible at the stage of description.
Литература
References
Рецензенты:
Мальцева Е.С. – кандидат экономических наук, доцент, АНО ВО «Институт бизнеса и дизайна»
Проданова Н.А. – доктор экономических наук, профессор кафедры финансового анализа и аудита ФГБОУ ВО «РЭУ им. Г.В. Плеханова»
Работа поступила в редакцию: 18.10.2018 г.
УДК 338.2(476)+316.42(476)
Shvayba Dmitriy Nikolaevich
PROBLEMATIC ISSUES IN THE ANALYSIS OF SOCIO-ECONOMIC SECURITY
The Minsk regional organization of the Belarusian trade Union of workers of chemical, mining and petroleum industries, Minsk, Belarus (220140, St. Ciurlionis 8-37), candidate of economic Sciences, member of the State expert Council of the State Committee for science and technologies of Republic of Belarus, doctoral student of Belarusian national technical University, ORCID: 0000-0001-6783-9765, shvabia@tut.by, +375 29 652 06 03.
Based on the article with the material is the ability of information analysis cube security: graduation of the means of defence in their relationship to threats; gradation of hazards according to their degree of influence; grading objects according to their degree of safety, etc. Described situation allows to systematize the studied elements based on the analysis of multidimensional data. Based on everything, it is possible to structure the dangers, defense methods, objects and other elements of security, taking into account their internal data. The special individuality of the proposed model of systematization is that it allows you to find hidden relationships and patterns between their internal structures, which are not always visible at the stage of description.
Key words: socio-economic security; the government; society; enterprise; employee; threat; security; interests; Economics, analysis, system.
Швайба Дмитрий Николаевич
ПРОБЛЕМНЫЕ ВОПРОСЫ ПРИ АНАЛИЗЕ СОЦИАЛЬНО-ЭКОНОМИЧЕСКОЙ БЕЗОПАСНОСТИ
Минская областная организация Белорусского профсоюза работников химической, горной и нефтяной отраслей промышленности, Минск, Беларусь (220140, г. Минск, ул. Чюрлениса 8-37), кандидат экономических наук, член Государственного экспертного совета Государственного комитета по науке и технологиям Республики Беларусь, докторант Белорусского национального технического университета, ORCID: 0000-0001-6783-9765, shvabia@tut.by, +375 29 652 06 03.
На основе изложенного в статье материала представляется возможность информационного анализа кубика безопасности: градация средств обороны по их соотношению к угрозам; градация опасностей по степени их влияния; градация объектов по степени их безопасности и т.д. Описанный расклад разрешает систематизировать исследуемые элементы, базируясь на анализе многомерных данных. Возможно структурировать опасности, способы обороны, объекты и иные элементы защищенности с учетом их внутренних данных. Особая индивидуальность предложенной модели систематизирования заключается в том, что она разрешает обнаружить сокрытые отношения и закономерности между их внутренними структурами, которые не всякий раз видимы на стадии описания.
Ключевые слова: социально-экономическая защищенность; государство; общество; предприятие; работник; угроза; защищенность; интересы; экономика, анализ, система.
In the analysis of socio-economic security can be used indicator, suitable in that its size is equal to the correlation coefficient of dichotomous symptoms, considered as quantitative:
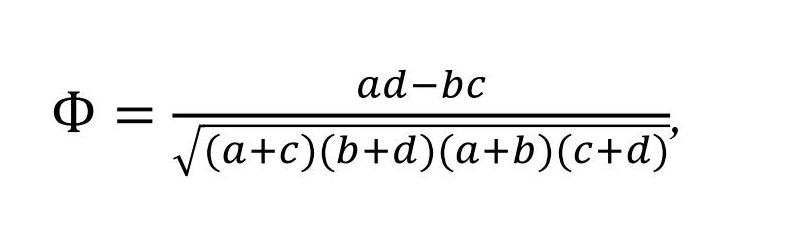 (1)
(1)In this consideration of dichotomous symptoms, it should be noted that the appropriate Boolean columns have (a+b) single values and (c+d) zero values for the 1st symptom and (a+c) single values and (b+d) zero values for the other symptom.
In General, every time it is expected that a symptom of any type has the ability to be represented by several gradations. In connection with this situation, in the theory of data analysis there is a problem of scaling the symptom, that is, measuring it in some selected on a specific aspect, due to the initial information, scale. Without touching upon the choice of measurement scales, I would like to point out that almost every time [1, p. 125] the aspect of the choice of this scale is the maximization of the correlation coefficients of these symptoms r of the matrix R:
 (2)
(2)Thus, in the process of solving problems aimed at identifying for gradations of non-quantitative symptoms of new relations, allowing to approach their quantitative measurement, 2 information sources are used:
- the data of experimental analysis, summarized in 1-well, the table is invisible and reflects the quantitative proportion between the characteristic values;
* a priori assumptions of the expert in a certain subject area, acquired in the analysis of the results of processing of experimental data [2].
Let G have an array of security cube scans. Guided by the structural description of the elements gi ( ) the selected array G, we can say that here we are dealing with multidimensional indicators. Let's analyze the element representation gi ( ) using the feature object table. Without limiting the generality, we assume that the chosen element g* - scan cube security in the plane Х0Z - "tools of protection and security challenges". The rows in this table correspond to the security tools, and the columns correspond to the array of possible security calls. The task that arises at this stage can be set in such a way: according to the existing description of the array of security tools, to identify security challenges that this complex can best counteract. For mathematical processing of the problem can be formalized.
Let there be a table object-a sign of dimension N×M, including sub-tables dimensions , where , which correspond to the specified feature (in a particular case - the call) Хк. Overall, the matrix Хк capable of having one of the following types:
- Хк - Boolean matrix of dimension with orthogonal columns that add up to a column that consists of units. In each row ХҺ contains one and only one unit. Thus, this feature creates a division into an array of objects;
- ХҺ - a Boolean column N×1 that forms a set of objects; this column describes a dichotomous trait with a fixed zero;
3) Хк - an arbitrary Boolean matrix . The columns of this matrix are not necessarily orthogonal to each other, and individual rows can be zero. The first fact means that the indicators of the symptom are not alternative, and the second-that for individual objects the indicators of symptoms are not specified. In fact, this submatrix can often be considered as an array of columns corresponding to certain symptom values, that is, as a set of symptoms specified in the form of 2.
The challenge is to model this quantitative symptom z, which is the closest to matrices Хk, and identify the rules of its interpretation in the descriptions of the primary symptoms.
To estimate the proximity of z to the original matrices, it seems logical to apply an estimate of the distances between the symptoms and their projections to the corresponding subspaces. At the same time, 2 symmetrical indicators are formed in a certain sense.
The 1st of them considers the proximity between the simulated symptom and its projections on subspaces L(Хk), which are created by primary symptoms:
 (3)
(3)where by means Рк the0 projector to the subspace is shown L(Хk).
The second explores the proximity between the primary matrices and their projections on the axis of the modeled indicator:
 (4)
(4)In this case, the problem of modeling the vector z is stated as the problem of reducing one of these indicators for all N-dimensional vectors z having a unit length, that is
 (5)
(5)It should be noted that 2 modeling problems are similar in mathematical structure. They should be considered as special cases of a more General modeling problem based on the study of "oblique" scalar products of the form , not , and "oblique" projectors ХВ'Х.
The formed problem is easier to solve by modeling the factor-projector, that is, using the criterion (4), since in this case the solution is less massive and more constructive. First of all, we note that
 (6)
(6)where performance X = (Х1,...,Хn) the entire table of primary data is formed. The formula (6) follows from the definition of the scalar product.
It is known that the problem of reducing the index z such that , the task of identifying the main components of the matrix X.
We investigate the matrix of conjugacy of features S=X’X. Its elements are scalar products of Boolean columns corresponding to various values of features. If λ1, λ2, …, λk - the eigenvalues of the matrix S over the field C. Since S is the Gram matrix, the eigenvalues are real and positive when detS≠0. Then a1, a2, …, ak - normalized eigenvectors of the matrix S corresponding to eigenvalues. This means that . Therefore,
 (7)
(7)Get that vector there is an eigenvector of the matrix , corresponding to the same eigenvalue , that and the vector , acting proper for the matrix . Since , that . Prohormones identified eigenvectors of a matrix and select them through z1, z2, …, z k:
 (8)
(8)Vectors you can call the main components of the matrix X.
For the interpretation of the obtained vector z it is necessary to estimate the weight of the occurrence of primary features ХҺ vector z. This assessment is more convenient, in General, to produce their investment in the amount of λ.
Let z be the eigenvector of the matrix XX', corresponding to the eigenvalue λ. Then
 (9)
(9)From the properties of the matrix we obtain that
 (10)
(10)It is evident that the task of the reduction indicator (4) corresponds to the objective of decreasing eigenvalues λ. Since
 (11)
(11)the analysis of λ adequate analysis of the vector z. λ is the sum of the values okharakterizovali the contribution of each of the combinations of indicators of symptoms in the optimized indicator. As a result of the corresponding transformations, it is possible to obtain
 (12)
(12)These values characterize the significance of symptoms, individual values and pairs of symptoms in terms of their contribution to the optimized indicator and have all chances to be used for the interpretation of the resulting factor. The larger the significance, the more relevant the symptom (or its exponent, depending on the presentation of the data) takes place in the identified vector z. As a consequence, the vector z can be considered as a formal representation of the generalizing opinion, which is presented in more important symptoms [3].
However, in our case representation is simplified. If we expand (9), it is possible to see that the vector z is a linear combination of the values of these symptoms. Data representation in the form of a conditional dichotomous symptom entails the selection of a specific subset of objects possessing the appropriate quality, not only specifies the partitioning of a large number of groups in relation to no one particular quality. As a consequence, presenting the components of a large number of G in the form of tables, we can only denote them as symptoms appear on the internal properties of these components in any particular case. Due to the fact that the task will be reduced to fixing the presence or absence of these manifestations, it is advisable to present symptoms in form 2. As a result, the formula of the main component will look like:
 (13)
(13)We see that in z the indicators of symptoms are summarized, which are estimated by the values аk, indicating the contribution of relevant indicators of symptoms Хk [4].
When the minimum symptom value (4) is not very small, it can be estimated as an indication that the primary data are not capable of being characterized by a single factor. In this case, in accordance with the General regulations of the method of the parent component as a method of approximation of the data, you should turn to the investigation of matrices of the residual ties , and find their maximum eigenvalue and corresponding normalized eigenvectors а2 and z2. Core components z1 and z2 are orthogonal and create a plane that best approximates the scorecard in the sense of the criterion , where Р - the operator of designing on a given plane. As the first p of the main components z1,z2,...,zр, modeled as eigenvectors corresponding to the maximum eigenvalues of residual matrices , reduce , where Р - modeling operator on L(Zp). The indicator of stopping the process of modeling the head components in accordance with the theory is the proximity to the unit of magnitude , since
 (14)
(14)With regard to the safety cube, the method allows, on the basis of the systematization carried out, to make compositions of objects/features that correspond to the set of specified data. For example, having identified inherent dangers, it is possible to assess the quality of the security system [5; 6]. Then there is the problem of approximation of the given vector available vectors. This linear regression problem.
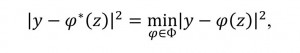
Let u-some output indicator, which should be described by the signs z1, z2,..., zk with some valid transformations (in this instance Ф(Z) = L(Z) - array of linear transformations). We need to find the nearest vector to y such that
 (15)
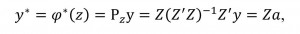
(15)It is known that the solution of the linear regression problem is the projection Рz у. So,
 (16)
(16)where a is the vector of coefficients of columns of Z.
In the generalized case, the columns of the matrix Z can be linearly dependent, then det(Z’Z)=0. In this case, under the matrix (Z’Z)-1 it is necessary to understand the generalized inverse matrix for Z’Z.
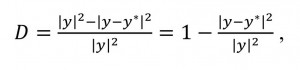
Assessment of the quality of the regression it is advisable to characterize the size
 (17)
(17)Indicator D is called the coefficient of determination and is modified in the range from 0 to 1. The proximity of D to 1 indicates that the residual dispersion not great, that is, the revealed description is not bad approximates y. In particular, D = 1 if and only if у = у*, so the required description is expressed by the formula (16). If D = 0, that that is у* = 0, so a linear description of u in terms z' no way.
Based on the above, there is the following possibility of information analysis of the security cube:
- gradation of the means of defence in their relationship to threats;
* gradation of hazards by their degree of influence;
* gradation of objects according to the degree of their safety, etc.
The described layout allows to systematize the studied elements based on the analysis of multidimensional data. Based on this, it is possible to structure the dangers, methods of defense, objects and other elements of security, taking into account their internal data. The special individuality of the proposed systematization model lies in the fact that it allows to detect hidden relationships and patterns between their internal structures, which are not always visible at the stage of description.
Литература
- Никифоров A. M. Методы и алгоритмы преобразования типов признаков в задачах анализа данных. Ташкент: Фан, 1988. 130 с.
- Мир на рубеже тысячелетий: прогноз развития мировой экономики до 2015 года / В. А. Мартынов [и др.] ; под ред. В. А. Мартынова, А. А. Дынкина. М.: Новый век, 2001. 591 с.
- Мировая экономика. Глобальные тенденции за 100 лет / Ю. Л. Адно [и др.]; под ред. И. С. Королева. М. : Юристъ, 2017. 603 с.
- Чернавский Д.С. Базовая динамическая модель экономики России: инструмент поддержки принятия решений / Д. С. Чернавский, Н. И. Старков, А. В. Щербаков. М.: [б. и.], 2001. 19 с.
- Shvaiba D. (2018). Structural stability and socio-economic security of the hierarchical system. Bulletin of Science and Practice, 4(6), 233-239. Режим доступа: http://www.bulletennauki.com/shvaiba-d-n-2018 (дата обращения 06.2018). DOI: 10.5281/zenodo.1289852.
- Shvaiba D. (2018). Socio-economic security of the hierarchical system. Bulletin of Science and Practice, 4(6), 248-254. Режим доступа: http://www.bulletennauki.com/shvaiba-d-n (дата обращения 06.2018). DOI: 10.5281/zenodo.1289862.
References
- Nikiforov A. M. Metody i algoritmy preobrazovaniya tipov priznakov v zadachakh analiza dannykh. Tashkent: Fan, 1988. 130 p.
- Mir na rubezhe tysyacheletiy: prognoz razvitiya mirovoy ekonomiki do 2015 goda / V. A. Martynov [i dr.] ; pod red. V. A. Martynova, A. A. Dynkina. M.: Novyy vek, 2001. 591 p.
- Mirovaya ekonomika. Global'nye tendentsii za 100 let / Yu. L. Adno [i dr.]; pod red. I. S. Koroleva. M. : Yurist, 2017. 603 p.
- Chernavskiy D.S. Bazovaya dinamicheskaya model' ekonomiki Rossii: instrument podderzhki prinyatiya resheniy / D. S. CHernavskiy, N. I. Starkov, A. V. SHCHerbakov. M.: [b. i.], 2001. 19 p.
- Shvaiba D. (2018). Structural stability and socio-economic security of the hierarchical system. Bulletin of Science and Practice, 4(6), 233-239. Rezhim dostupa: http://www.bulletennauki.com/shvaiba-d-n-2018 (data obrashcheniya 15.06.2018). DOI: 10.5281/zenodo.1289852.
- Shvaiba D. (2018). Socio-economic security of the hierarchical system. Bulletin of Science and Practice, 4(6), 248-254. Rezhim dostupa: http://www.bulletennauki.com/shvaiba-d-n (data obrashcheniya 15.06.2018). DOI: 10.5281/zenodo.1289862.
Рецензенты:
Мальцева Е.С. – кандидат экономических наук, доцент, АНО ВО «Институт бизнеса и дизайна»
Проданова Н.А. – доктор экономических наук, профессор кафедры финансового анализа и аудита ФГБОУ ВО «РЭУ им. Г.В. Плеханова»
Работа поступила в редакцию: 18.10.2018 г.